
In today’s data-driven world, effectively tracking the right marketing metrics is crucial for success. Simply throwing money at campaigns and hoping for the best is no longer a viable strategy. Marketing metrics provide invaluable insights into campaign performance, customer behavior, and overall return on investment (ROI). By understanding which marketing metrics to track, you can make informed decisions, optimize your campaigns, and ultimately drive business growth. This article will explore the key marketing metrics you should be monitoring to ensure your marketing efforts are yielding the desired results. We’ll delve into why these specific metrics are important and how they can help you achieve your marketing goals.
Focusing on vanity metrics like follower count or likes might seem appealing, but they often fail to provide actionable insights. Instead, you should prioritize metrics that matter, those directly tied to your business objectives. Whether your goal is to increase brand awareness, generate leads, or drive sales, tracking the right marketing metrics will provide you with the data you need to understand what’s working, what’s not, and how to improve. This article will cover essential marketing metrics across various channels, including website analytics, social media metrics, email marketing metrics, and more. By the end, you’ll have a clear understanding of which metrics to prioritize and how to use them to make data-driven decisions that impact your bottom line.
Why Metrics Matter
Metrics are critical for understanding performance and driving informed decisions. They provide quantifiable data that allows businesses to track progress towards goals, identify areas for improvement, and measure the effectiveness of strategies. Without metrics, organizations operate on assumptions and gut feelings, which can lead to inefficient resource allocation and missed opportunities. Metrics provide the evidence necessary to evaluate success and make necessary adjustments to achieve desired outcomes.
Choosing the right metrics is paramount. Key Performance Indicators (KPIs) should be directly aligned with business objectives and tailored to specific departments or projects. For example, a marketing team might track website traffic, conversion rates, and customer acquisition cost, while a sales team might focus on revenue, deal size, and sales cycle length. By focusing on relevant KPIs, organizations can gain valuable insights into their operations and identify areas where they excel or require attention.
Regularly monitoring and analyzing metrics is essential for continuous improvement. Tracking metrics over time reveals trends and patterns that inform strategic decision-making. This process allows organizations to proactively address potential problems, optimize processes, and adapt to changing market conditions. By using data-driven insights, businesses can improve efficiency, increase profitability, and achieve sustainable growth.
Vanity Metrics vs Actionable Data
Vanity metrics might look impressive on a report, but they offer little real value in terms of understanding business performance or informing future strategies. Metrics like social media followers or website page views can create a false sense of success. While these numbers might be large, they don’t necessarily translate to increased revenue, customer loyalty, or other key performance indicators (KPIs). Focusing solely on vanity metrics can distract from identifying the true drivers of growth.
Actionable data, on the other hand, provides valuable insights that directly influence decision-making and drive positive change. These metrics are often tied to specific business objectives and provide a clear understanding of user behavior and engagement. Examples of actionable data include customer churn rate, conversion rates, and customer lifetime value. By analyzing these metrics, businesses can identify areas for improvement, optimize campaigns, and ultimately achieve measurable results.
The key difference lies in the impact on business decisions. While vanity metrics might provide a fleeting sense of accomplishment, actionable data empowers businesses to make informed decisions, improve their strategies, and achieve sustainable growth.
Key KPIs by Campaign Type
Different campaign types prioritize different Key Performance Indicators (KPIs). For brand awareness campaigns, focus on metrics like reach, impressions, and engagement (likes, shares, comments). Tracking these KPIs helps assess how effectively the campaign expands brand visibility and fosters audience interaction. Analyzing sentiment and share of voice can also provide valuable insights.
Lead generation campaigns, on the other hand, emphasize KPIs such as conversion rates, cost per lead (CPL), and the number of qualified leads. These metrics gauge the effectiveness of the campaign in capturing potential customer information and moving them down the sales funnel. Tracking form submissions, demo requests, and content downloads provides valuable data for optimization.
Finally, sales-driven campaigns prioritize revenue, return on ad spend (ROAS), and customer lifetime value (CLTV). Focusing on these bottom-line metrics helps determine the campaign’s effectiveness in generating sales and driving profitability. Tracking website conversions, purchases, and average order value provides crucial information for measuring campaign success.
Understanding CAC and LTV
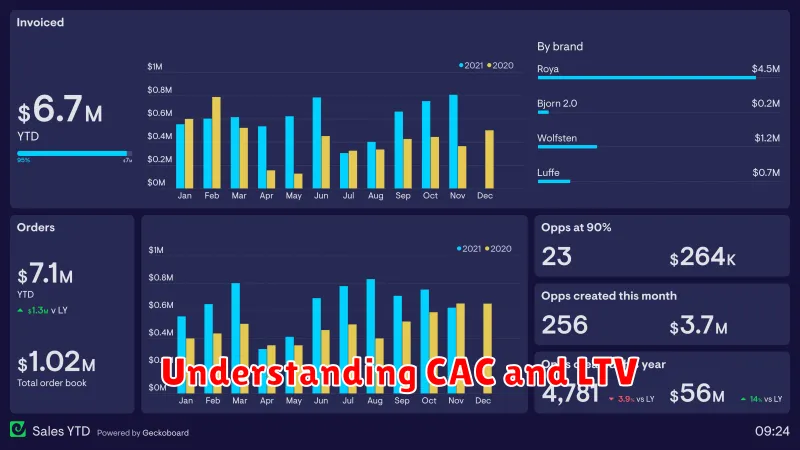
Customer Acquisition Cost (CAC) refers to the total cost a business incurs to acquire a new customer. This includes marketing and sales expenses, such as advertising costs, salaries, commissions, and software subscriptions. Calculating CAC involves dividing the total costs associated with acquiring customers by the number of customers acquired over a specific period. A lower CAC signifies efficiency in acquiring new customers, while a high CAC can strain profitability.
Lifetime Value (LTV) represents the predicted total revenue a business expects from its relationship with a single customer. A higher LTV indicates stronger customer relationships and potential for long-term profitability. Factors influencing LTV include average purchase value, purchase frequency, and customer lifespan. Understanding LTV helps businesses make informed decisions about sales, marketing, product development, and customer support.
The relationship between CAC and LTV is crucial for evaluating business health. Ideally, the LTV should significantly exceed the CAC. A commonly cited benchmark is a 3:1 LTV to CAC ratio. A lower ratio suggests potential problems with customer retention, pricing, or marketing effectiveness, while a higher ratio indicates a sustainable and profitable business model.
Tracking Conversion Rates
Tracking conversion rates is crucial for evaluating the effectiveness of marketing campaigns and website optimization efforts. A conversion rate represents the percentage of visitors who complete a desired action, such as making a purchase, filling out a form, or subscribing to a newsletter. By monitoring these rates, businesses can identify areas for improvement and allocate resources more effectively.
Several key metrics are involved in tracking conversion rates. These include the total number of visitors, the number of conversions, and the resulting percentage. Analyzing these metrics across different channels (e.g., social media, email marketing, organic search) provides valuable insights into which strategies are performing well and which need adjustment. Regularly analyzing conversion rates enables businesses to understand customer behavior and optimize their approach to maximize ROI.
Tools and techniques for tracking conversion rates vary. Website analytics platforms offer built-in conversion tracking features, allowing businesses to set up goals and track progress. A/B testing is another valuable technique, enabling comparison of different versions of a webpage or ad to determine which performs better in terms of conversions. By understanding and utilizing these tools and techniques, businesses can gain a competitive edge.
Attribution Modeling Explained
Attribution modeling is the process of determining which marketing touchpoints receive credit for a conversion. It assigns a value to each interaction a customer has with your brand leading up to a desired action, like a purchase or sign-up. Understanding these touchpoints helps marketers optimize campaigns and allocate budget effectively.
Several models exist, ranging from simple to complex. Single-touch models like First Touch and Last Touch attribute all credit to a single interaction. Multi-touch models like Linear, Time Decay, and Position-Based distribute credit across multiple touchpoints. Choosing the right model depends on the complexity of the customer journey and business objectives.
By analyzing attribution data, marketers can gain valuable insights into the effectiveness of their marketing efforts. This information can be used to improve messaging, refine targeting, and ultimately drive more conversions by focusing on the channels that deliver the best results.
Using Funnels for Insight
Funnels are a powerful analytical tool used to understand the step-by-step progression of users through a process. They provide valuable insights into where users drop off, allowing businesses to identify pain points and optimize conversion rates. By visualizing each stage, funnels reveal areas needing improvement, whether it’s simplifying a form, clarifying instructions, or streamlining the user experience.
A typical funnel might track the journey of a customer from visiting a website to completing a purchase. Each stage represents a specific action, such as adding an item to the cart, entering shipping information, or confirming payment. Analyzing the drop-off rates between each stage can highlight bottlenecks and inform targeted interventions. For example, a high drop-off rate between adding an item to the cart and entering shipping information might suggest issues with the complexity of the checkout process.
By leveraging the insights gleaned from funnel analysis, businesses can make data-driven decisions to improve their processes and ultimately achieve their desired outcomes. This could involve simplifying navigation, offering more payment options, or improving customer support. Regularly monitoring and refining funnels is essential for maintaining a healthy conversion rate and achieving business objectives.
Real-Time vs Long-Term Tracking
Real-time tracking focuses on the immediate location of an object or individual. It provides up-to-the-minute data, useful for applications requiring immediate feedback, such as monitoring delivery vehicles or tracking assets within a warehouse. This type of tracking often relies on technologies like GPS and requires a constant connection to transmit data. The focus is on current position and less on historical movement.
Long-term tracking, conversely, emphasizes the collection and analysis of location data over an extended period. It is less concerned with instantaneous updates and more with identifying patterns, trends, and historical context. This type of tracking is valuable for understanding movement history, analyzing behavior, and making predictions. Applications include studying animal migration, analyzing traffic patterns, or evaluating the long-term effectiveness of marketing campaigns. Data storage and analysis capabilities are crucial in long-term tracking.
Choosing between real-time and long-term tracking depends entirely on the specific needs of the application. Consider the time sensitivity of the data, the importance of historical context, and the resources available for data storage and processing when making your decision. Each method offers distinct advantages for particular use cases.
Reporting for Stakeholders
Effective stakeholder reporting is crucial for maintaining transparency and building trust. It provides stakeholders with the necessary information to understand an organization’s performance, progress towards goals, and potential impacts on their interests. A well-structured report should clearly communicate key metrics, achievements, and challenges, using concise and accessible language. This enables stakeholders to make informed decisions and engage effectively with the organization.
Different stakeholders have varying information needs. Investors prioritize financial performance and return on investment. Employees are interested in job security, career development, and company culture. Customers value product quality, customer service, and ethical sourcing. Communities focus on environmental impact, social responsibility, and local economic development. Tailoring reports to address the specific concerns of each stakeholder group is essential for building strong relationships and fostering mutual understanding.
Key components of an effective stakeholder report may include: a summary of key performance indicators (KPIs), a discussion of progress towards strategic goals, an overview of challenges and risks, and a description of the organization’s commitment to sustainability and ethical practices. By providing this information in a transparent and accessible manner, organizations can demonstrate accountability and build trust with their stakeholders.
Tools for Reliable Data
Ensuring data reliability requires utilizing the right tools. Data validation tools help enforce data integrity by checking for inconsistencies and errors. Examples include data profiling tools that analyze data for patterns and anomalies, and data quality tools that automate data cleansing and standardization processes. These tools are crucial for identifying and correcting inaccurate or incomplete data.
Data integration tools combine data from various sources to create a unified view. Extract, Transform, Load (ETL) tools allow for the extraction of data from different systems, its transformation into a consistent format, and finally, loading into a target database or data warehouse. These tools are essential for creating a single source of truth and avoiding data silos.
Data monitoring tools track data quality metrics over time, alerting users to potential issues. These tools can identify trends in data accuracy, completeness, and consistency, enabling proactive interventions. By consistently monitoring data, organizations can maintain high levels of data reliability and minimize the impact of data errors on business decisions.