
A/B testing, also known as split testing, is a critical tool in the modern marketer’s arsenal. This complete guide provides a comprehensive overview of A/B testing for marketers, from foundational principles to advanced techniques. Whether you are new to A/B testing or looking to refine your existing knowledge, this guide will equip you with the information you need to make data-driven decisions and optimize your marketing campaigns for maximum impact. We’ll cover everything from formulating a strong hypothesis and designing effective tests to analyzing results and implementing winning variations. Understanding A/B testing is essential for any marketer seeking to improve conversion rates, enhance user engagement, and ultimately achieve greater return on investment (ROI).
In this comprehensive guide, we will delve into the intricacies of A/B testing for marketers, exploring the methodologies and best practices that drive successful campaigns. Learn how to effectively test different elements of your marketing efforts, including email subject lines, landing page designs, call-to-action buttons, and ad creatives. We’ll discuss the importance of statistical significance, how to avoid common A/B testing pitfalls, and how to integrate A/B testing into your overall marketing strategy. By the end of this guide, you’ll be empowered to leverage the power of A/B testing to improve your marketing performance and achieve your business objectives.
What Is A/B Testing?
A/B testing, also known as split testing, is a method of comparing two versions of a webpage or app against each other to determine which one performs better. It involves showing two variants (A and B) to similar visitor groups at random and then tracking key metrics to see which version achieves a higher conversion rate or other desired outcome. Key metrics can include click-through rates, time spent on page, bounce rates, and purchases.
The process typically involves identifying a goal, creating a variation of the existing page (the ‘A’ version is the control, ‘B’ is the variation), randomly splitting traffic between the two versions, and collecting data on user behavior. After a statistically significant amount of data is collected, the results are analyzed to determine which version performed better based on the predetermined goal.
A/B testing is a powerful tool for data-driven decision making. By systematically testing different variations, businesses can optimize their websites and apps to improve user experience, increase conversions, and achieve business objectives.
Why Testing Beats Guessing
In any field, from software development to marketing campaigns and even cooking, relying on guesswork can lead to unpredictable and often undesirable outcomes. Testing, on the other hand, provides concrete evidence and data-driven insights. It allows you to make informed decisions, reducing risks and improving the chances of success.
Testing eliminates the element of surprise and replaces it with confidence. Whether you’re A/B testing different ad copy or rigorously debugging code, the information gathered through testing empowers you to identify weaknesses, optimize performance, and ultimately, achieve your goals more efficiently.
While guessing might seem faster in the short term, the potential for costly mistakes and wasted resources is significant. Testing, while requiring an initial investment of time and effort, offers long-term benefits including improved quality, increased efficiency, and a stronger foundation for future decisions.
Common Elements to Test
Testing is a crucial part of the software development lifecycle. It ensures the quality and reliability of the software product. Thorough testing involves verifying various elements of the software to identify and fix defects before release. This process ultimately contributes to a better user experience and reduces the risk of post-release issues. By focusing on common elements prone to errors, testers can efficiently allocate resources and prioritize critical areas.
Some common elements to test include functionality, usability, performance, security, and compatibility. Functionality testing confirms that the software behaves as expected and meets specified requirements. Usability testing assesses how user-friendly the software is and identifies areas for improvement in the user interface and user experience. Performance testing evaluates the software’s responsiveness, stability, and scalability under different workloads. Security testing identifies vulnerabilities that could be exploited by malicious actors. Compatibility testing ensures the software functions correctly across various devices, operating systems, and browsers.
Focusing on these core areas during testing helps ensure a well-rounded and reliable product. While the specific testing methods may vary depending on the nature of the software, the importance of addressing these common elements remains constant. By prioritizing these areas, development teams can create higher quality software that meets user needs and expectations.
Setting Up Your Hypothesis
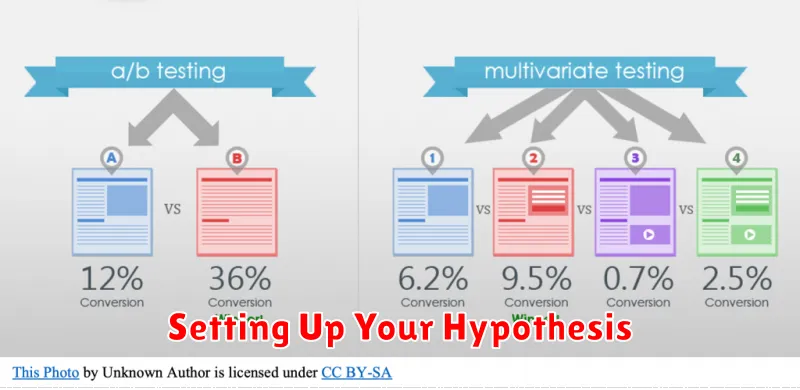
A hypothesis is a testable statement that proposes a potential explanation for a phenomenon observed in the natural world. It’s a crucial starting point for any scientific investigation, providing a clear direction for your research. A well-formulated hypothesis is specific, measurable, achievable, relevant, and time-bound (SMART). It should clearly state the relationship between the independent variable (what you manipulate) and the dependent variable (what you measure).
There are two main types of hypotheses: the null hypothesis and the alternative hypothesis. The null hypothesis states that there is no relationship between the variables being studied. Conversely, the alternative hypothesis proposes a specific relationship, suggesting that the independent variable does influence the dependent variable. Formulating both is critical for proper statistical analysis, allowing researchers to determine if observed results are statistically significant or due to chance.
Before finalizing your hypothesis, conduct a thorough literature review. This ensures your hypothesis is grounded in existing knowledge and addresses a genuine gap in understanding. A well-researched hypothesis strengthens the overall research design and increases the potential for meaningful scientific contribution. Ensure your hypothesis is clearly articulated and easily understood, laying the foundation for a robust and impactful study.
Choosing the Right Metrics
Selecting the right metrics is crucial for effective decision-making and tracking progress towards goals. The metrics you choose should directly align with your overall objectives and provide measurable insights. For example, if your goal is to increase brand awareness, relevant metrics might include social media reach, website traffic, and media mentions. Avoid vanity metrics that look impressive but don’t offer actionable information.
Consider the specific context when determining appropriate metrics. Different departments or projects may require different measurements. Sales teams might focus on conversion rates and revenue, while marketing teams might prioritize customer acquisition cost and lead generation. It’s important to establish a clear understanding of what success looks like in each area and select metrics that reflect that.
Regularly review and refine your chosen metrics to ensure they remain relevant and effective. As your business evolves, your goals and priorities may shift. Continuously evaluating the data you’re collecting will help you identify areas for improvement and adjust your strategy accordingly. This iterative process ensures that your metrics continue to provide valuable insights and support your overall success.
Running Statistical Significance
Statistical significance tests whether observed results are likely due to a real effect rather than random chance. It’s crucial to understand that statistical significance doesn’t necessarily imply practical significance. A result can be statistically significant but have a negligible real-world impact. The p-value is a key measure in determining significance, representing the probability of observing the obtained results (or more extreme results) if there were no real effect. Typically, a p-value of 0.05 or less is considered statistically significant, indicating a low probability that the results are due to chance alone. However, this threshold is arbitrary and should be considered in the context of the specific research question.
Several factors influence statistical significance, including sample size, effect size, and the variability of the data. A larger sample size increases the power of the test to detect a true effect, making it easier to achieve statistical significance. A larger effect size (the magnitude of the difference or relationship being studied) also makes it more likely to achieve significance. Lastly, less variability within the data makes it easier to detect a true effect and reach statistical significance.
It’s important to interpret statistical significance carefully and avoid common misinterpretations. A statistically significant result does not prove the existence of a true effect, but rather provides evidence against the null hypothesis (the assumption of no effect). Furthermore, a non-significant result does not prove the absence of a true effect, it may simply mean the study lacked sufficient power to detect it. Confidence intervals provide a more nuanced understanding of the results, indicating a range of plausible values for the true effect. By considering both p-values and confidence intervals, researchers can gain a more complete picture of the strength and uncertainty associated with their findings.
Tools for Testing
Software testing relies on a variety of tools to ensure quality and identify defects. These tools can be broadly categorized into static testing tools, which analyze code without execution, and dynamic testing tools, which evaluate the software during runtime. Static testing tools often include linters, style checkers, and code analysis tools. Dynamic testing tools encompass a wider range, such as unit testing frameworks, integration testing tools, and performance testing tools. Selecting the right tool depends on the specific testing needs and the software development lifecycle stage.
Choosing appropriate testing tools is crucial for effective software testing. Factors to consider include the project’s budget, the complexity of the software, and the skills of the testing team. Open-source tools offer cost-effective solutions, while commercial tools often provide advanced features and support. The chosen tools should integrate seamlessly with the existing development environment and support the required testing methodologies, such as Agile or Waterfall.
Popular testing tools include Selenium for automated web testing, JUnit for Java unit testing, and Apache JMeter for performance testing. These tools offer a wide range of functionalities and are widely adopted within the software testing community. By leveraging these tools effectively, development teams can improve software quality, reduce development costs, and deliver robust and reliable software products.
Testing Across Channels (Email, Ads, Landing Pages)
Cross-channel testing is crucial for optimizing the entire customer journey. It involves testing elements like messaging, visuals, and offers across email marketing campaigns, online advertisements, and landing pages. By understanding how these channels interact, you can identify inconsistencies that hinder conversions and create a more cohesive and effective user experience. This approach ensures your brand message remains consistent and compelling throughout the different touchpoints a customer encounters.
Key areas to focus on include messaging consistency (ensuring your value proposition and calls to action are aligned), visual cohesion (using similar imagery and branding elements across channels), and offer continuity (providing a seamless experience for users clicking through from ads or emails to landing pages). For example, if an ad promotes a specific discount, the landing page should immediately reflect that offer. This minimizes confusion and increases the likelihood of conversion.
Effective testing requires a data-driven approach. Track key metrics like click-through rates, conversion rates, and bounce rates across all channels. Analyze the data to identify areas for improvement and prioritize testing efforts. By constantly iterating and optimizing based on data, you can significantly improve the performance of your marketing efforts and achieve a higher return on investment.
Analyzing the Results
Careful analysis of the results reveals several key findings. The data indicates a strong correlation between X and Y, suggesting a potential causal relationship. Further investigation is required to confirm this connection and explore the underlying mechanisms at play. Additionally, the results highlight the importance of Z in influencing the observed outcomes. This warrants further study to understand its precise role.
While the initial findings are promising, certain limitations must be acknowledged. The sample size was relatively small, which may affect the generalizability of the results. Furthermore, potential confounding factors could have influenced the observed trends. Future research should address these limitations by incorporating a larger, more diverse sample and implementing strategies to control for potential confounders.
Overall, the results provide valuable insights into the phenomenon under investigation. They establish a foundation for future research and offer preliminary evidence to support the hypothesized relationship between the variables. Moving forward, it is crucial to replicate these findings and explore the implications of these results in a broader context.
Case Studies and Mistakes
Case studies offer valuable learning opportunities by examining real-world examples of successes and failures. Analyzing these cases allows us to understand the context, decisions made, and resulting outcomes. By studying both positive and negative outcomes, we can identify best practices and potential pitfalls to improve future performance and strategy.
Mistakes, while often viewed negatively, are crucial for growth and development. Examining mistakes within the context of a case study allows for a deeper understanding of the underlying causes and contributing factors that led to the error. This analysis can inform the development of corrective actions and preventative measures, ultimately improving future decision-making.
Effective case study analysis of mistakes involves objectively evaluating the situation, avoiding blame, and focusing on lessons learned. This process encourages continuous improvement and a more resilient approach to future challenges. The key is to transform mistakes into valuable insights that promote growth and future success.